Scaling AI Models Like You Mean It
April 4, 2024 • Written By Sean Sheng
If you’re reading this article, you probably need no introduction to the advantages of deploying open-source models. Over the past couple of years, we have seen incredible growth in the both the quantity and quality of open source models.
- Platforms such as Hugging Face have democratized access to a wide array of models, including Large Language Models (LLMs) and diffusion models, empowering developers to innovate freely and efficiently.
- Developers enjoy greater autonomy, as they can fine-tune and combine different models at will, leading to innovative approaches like Retrieval-Augmented Generation (RAG) and the creation of advanced agents.
- From an economic perspective, open-source models provide substantial cost savings, enabling the use of smaller, specialized models that are more budget-friendly compared to general-purpose models like GPT-4.
Open-source models present an attractive solution, but what’s the next hurdle? Unlike using a model endpoint like OpenAI, where the model is a scalable black box behind the API, deploying your own open-source models introduces scaling challenges. It’s crucial to ensure that your model scales effectively with production traffic and maintains a seamless experience during traffic spikes. Additionally, it’s important to manage costs efficiently, so you only pay for what you use and avoid any financial surprises at the end of the month.
True north: Serverless functions and more
Interestingly, this sounds like a challenge that modern serverless architectures, like AWS Lambda, have already solved — a solution that have existed for almost a decade. However, when it comes to AI model deployment, this isn't quite the case.
The limitations of serverless functions for AI deployments are multifaceted.
- No GPU support. Platforms like AWS Lambda don't support GPU. This isn't merely a technical oversight; it's rooted in architectural and practical considerations.
- GPUs cannot be easily shared. GPUs, while powerful and highly parallelizable as devices, is not as flexible as CPUs in handling multiple inference tasks on different models simultaneously.
- GPUs are very expensive. They're the high-performance sports cars of the computing world, exceptional for specific tasks but costly to maintain, especially if not utilized continuously.
Next, let’s take a look at our scaling journey and the important lessons we have learned along the way.
The cold start problem
Before we could even begin to work on scaling, we have the notorious "cold start" problem. This issue presents itself in three different stages:
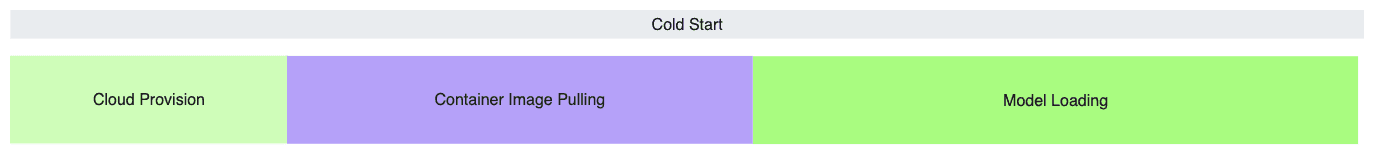
- Cloud provisioning: This phase involves the time it takes for a cloud provider to allocate an instance and integrate it into our cluster. This process varies widely, ranging from as quick as 30 seconds to several minutes, and in some cases, even hours, especially for high-demand instances like the Nvidia A100 and H100 GPUs.
- Container image pulling: Unlike simple Python job images, AI model serving images are very complex, due to the dependencies and custom libraries they require. Although cloud providers boast multi-gigabit network bandwidth, our experience often saw download speeds far below them, with image pulling time of three to five minutes.
- Model loading. The time required here is largely dependent on the model's size, with larger models like LLMs and diffusion models taking significantly longer time due to their billions of parameters. A helpful rule of thumb we discovered is to estimate the model's size to download in gigabytes by multiplying its number of parameters by two (the half-precision storage format typically used on disk). For example, loading a 5GB model like Stable Diffusion 2 might take approximately 1.3 minutes with 1Gbps internet bandwidth, while larger models like Llama 13B and Mixtral 8x7B could require 3.5 minutes and 12.5 minutes respectively.
Each phase of the cold start issue demands specific strategies to minimize delays. In the following sections, we'll explore each of them in more detail, sharing our strategies and solutions to achieving scalable, efficient GPU deployment for AI models.
Cloud provisioning
In contrast to the homogeneous environment of serverless CPUs, managing a diverse range of compute instance types is crucial when dealing with GPUs, each tailored for specific use cases. For instance, IO-bound LLMs require high GPU memory bandwidth and capacity, while generative models need more powerful GPU compute.
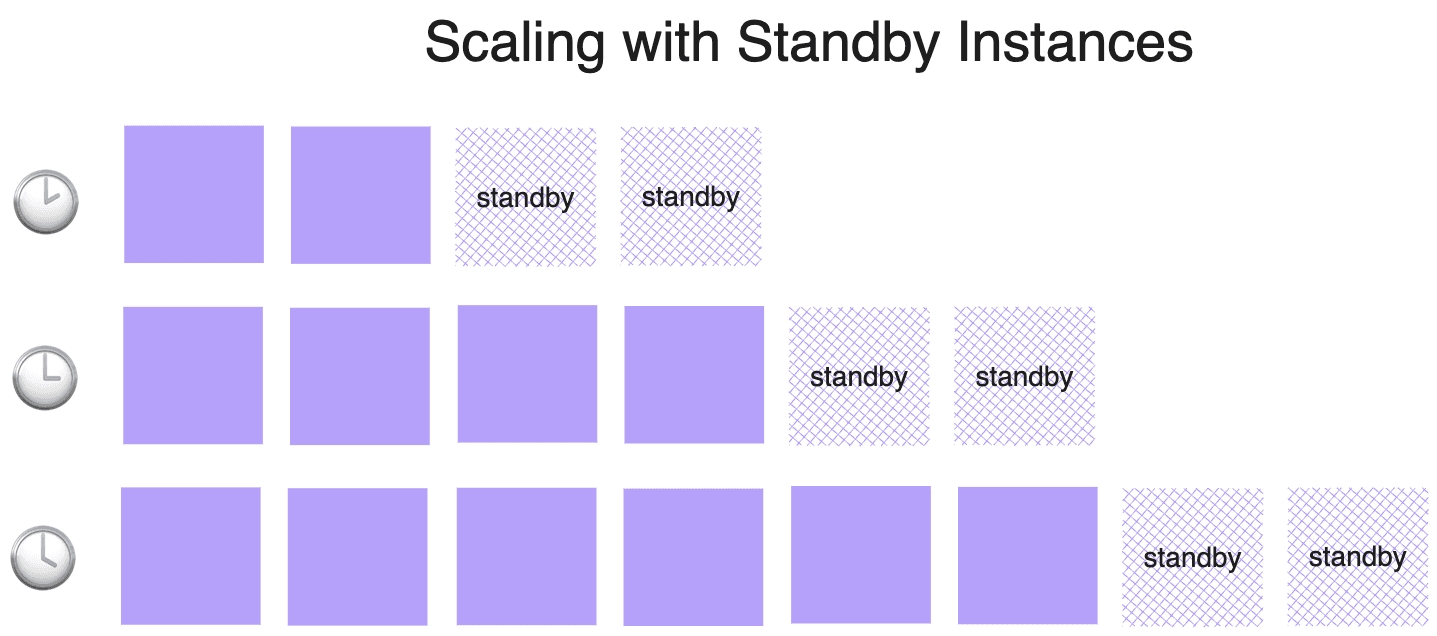
Ensuring availability during peak traffic by maintaining all GPU instance types could lead to prohibitively high costs. To avoid the financial strain of idle instances, we implemented a "standby instances” mechanism. Rather than preparing for the maximum potential load, we maintained a calculated number of standby instances that match our incremental scaling steps. For example, if we scale by two GPUs at a time, we need to have two standby instances ready. This allows us to quickly add resources to our serving fleet as demand surges, significantly reducing wait time, while keeping cost manageable.
In a multi-tenant environment, where multiple teams or, in our case, multiple organizations, share a common resource pool, we can achieve more efficient utilization rates. This shared environment allows us to balance varying resource demands, contributing to improved cost efficiency. However, managing multi-tenancy introduces challenges, such as enforcing quotas and ensuring network isolation, which can add complexity to the cluster.
Container image pulling
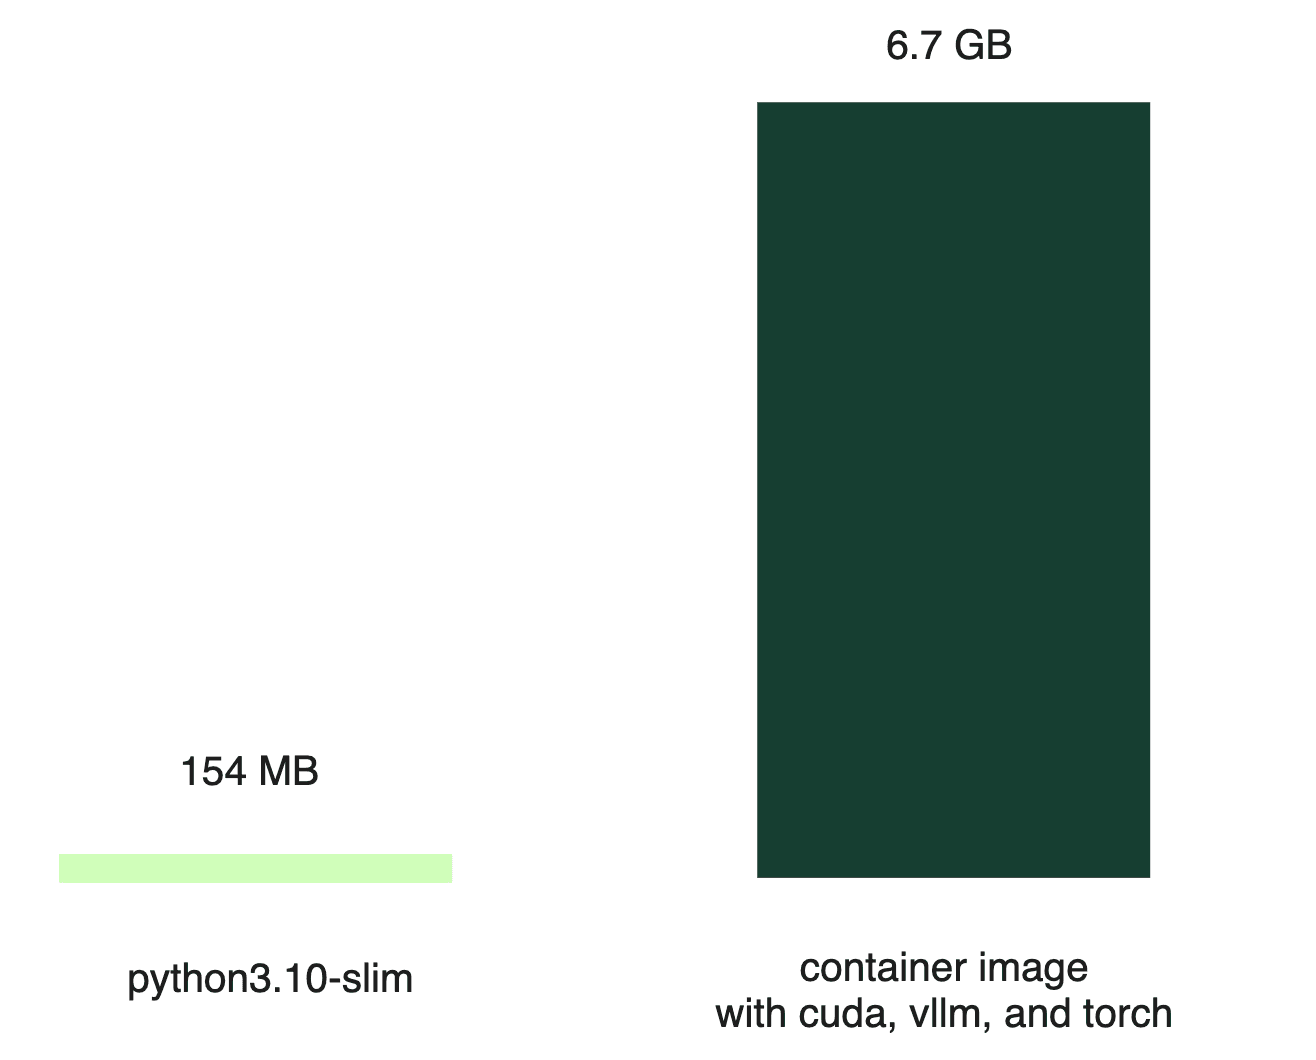
Serverless CPU workloads often use lightweight images, like the Python slim image (around 154 MB). In stark contrast, a container image built for serving an LLM can be much larger (6.7 GB even when compressed); the bulk of this size comes from the various dependencies required to run the AI model.
Despite high-bandwidth networks advertised by cloud providers, the reality often falls short, with actual download speeds being a fraction of the promised rates.
Practically, a significant portion of the files were never used. One way is to optimize the container image itself, but that quickly proved to be unmanageable. Instead, we shifted our focus to an on-demand file pulling approach. Specifically, we first downloaded only the image metadata, with the actual remote files being fetched later as needed. In addition, we leveraged peer-to-peer networking within the cluster to dramatically increase pulling efficiency.
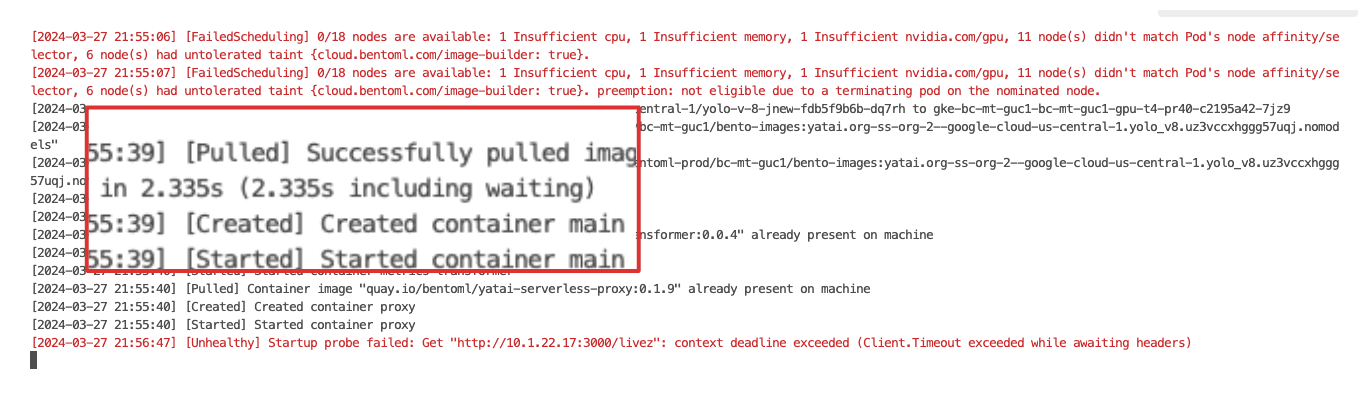
With these optimizations, we reduced the image pulling time from several minutes to mere seconds. However, we all know this measurement is "cheating" since the actual files are not pulled at this stage. The real file pulling occurs when the service runs. Therefore, it's crucial to have a service framework that allows you to define behaviors at various lifecycle stages, such as initialization and serving. By doing most, if not all, of the bootstrapping during initialization, we can ensure that all file dependencies are pulled. This way, when it comes to serving time, there are no delays caused by file pulling.
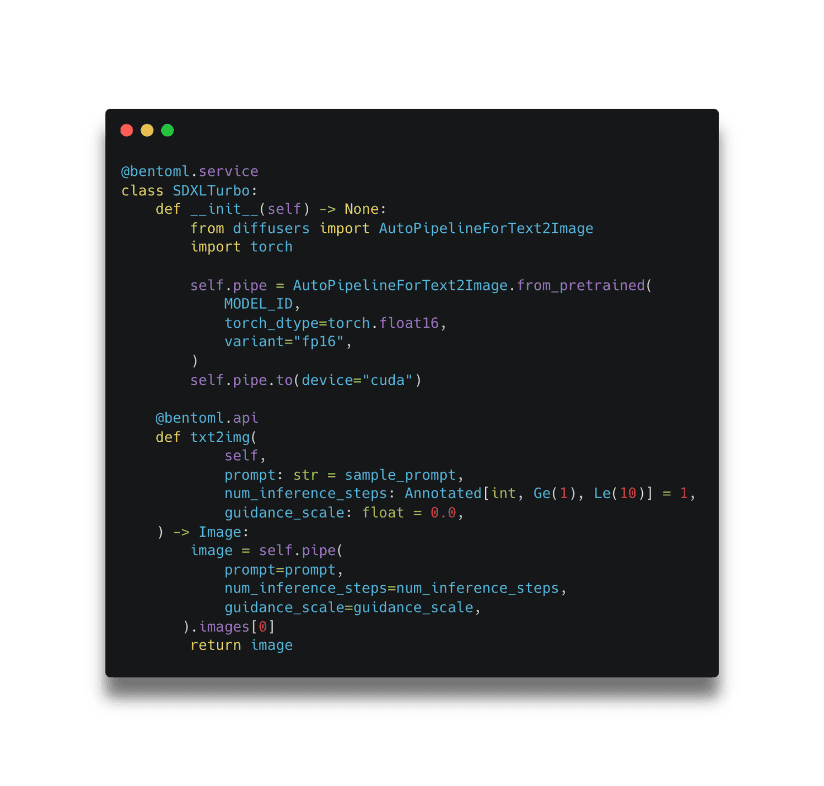
In the above example, model loading is done during the initialization lifecycle within __init__ and serving happens within the @bentoml.api named txt2img.
Model loading
Initially, the most straightforward method for model loading was to fetch it directly from a remote store like Hugging Face. Using Content Delivery Networks (CDNs), NVMe SSDs, and shared memory, we could sidestep some of the bottlenecks. While this worked, it was far from optimal.
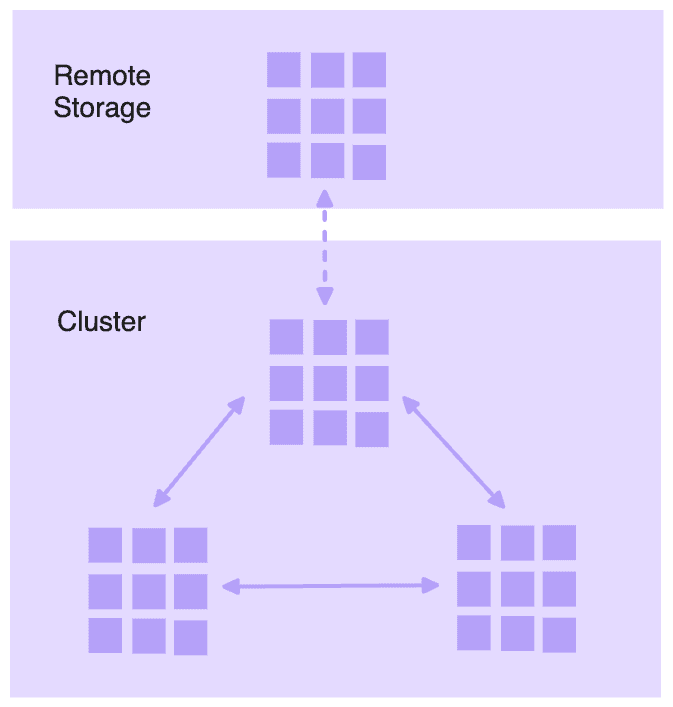
To improve this process, we considered our in-region network bandwidth. We seeded models in our distributed file systems and broke them into smaller chunks, allowing for parallel downloads. This drastically improved performance, but we still encountered cloud provider network bottlenecks.
In response, we further optimized to leverage in-cluster network bandwidth by using peer-to-peer sharing and tapping into local caches. While the improvements were substantial, they added a layer of complexity to the process, which we need to abstract away from the developers.
Even with the above practices, we still suffer from a sequential bottleneck: the need to wait for each step to complete before proceeding with the next. Models had to be downloaded to persistent drive entirely before loading into CPU memory, and then into the GPU.
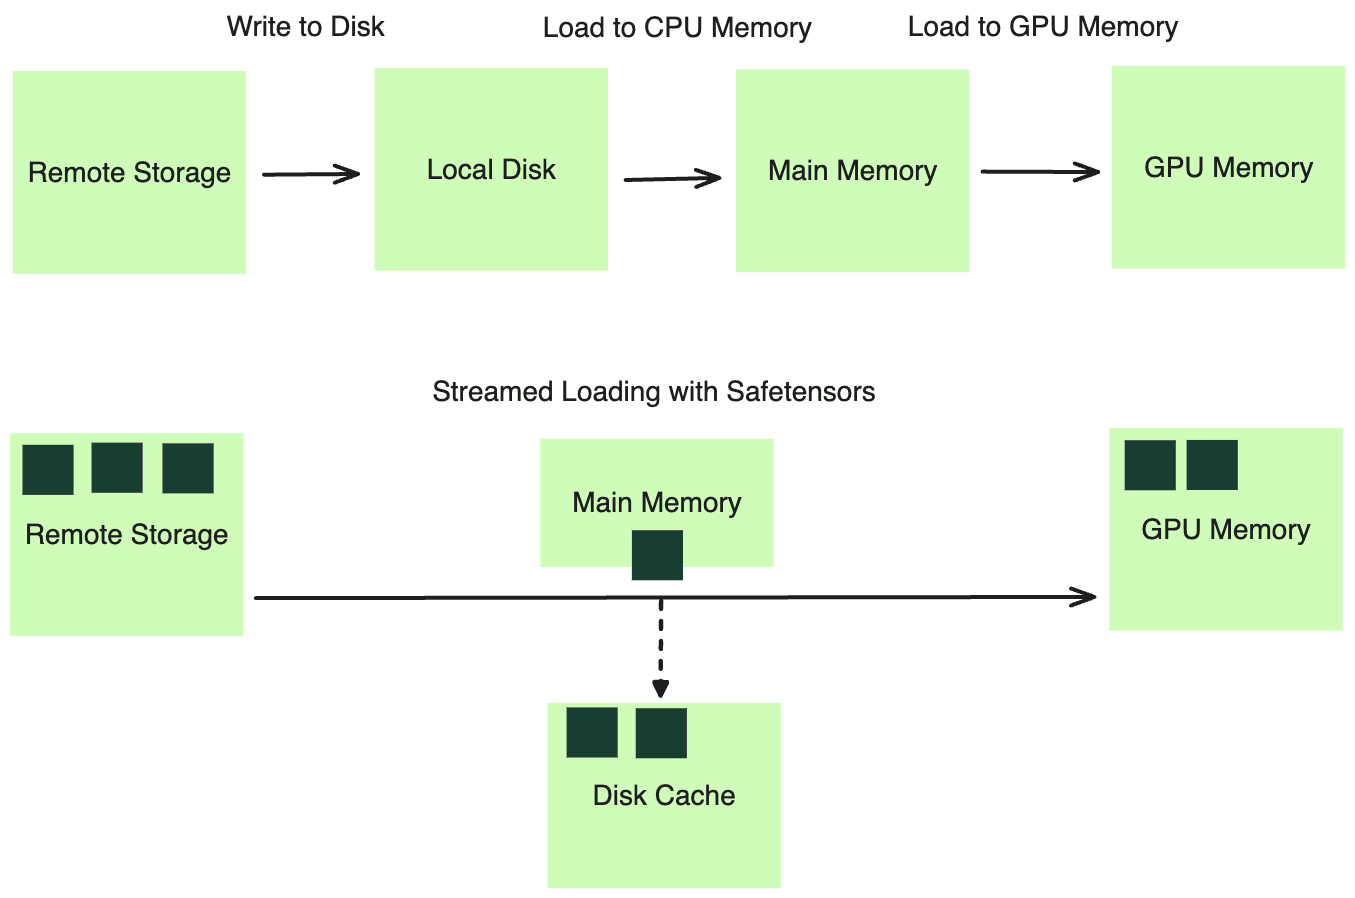
We turned to a stream-based method for loading model weights, using the distributed file cache system we had in place. This system allows programs to operate as if all files were logically available on disk. In reality, the required data is fetched on-demand from remote storage therefore bypassed disk writing. By leveraging a format like Safetensors, we can efficiently load the model weights into the main memory through memory mapping (mmap) before loading to the GPU memory in a streaming fashion.
Moreover, we adopted asynchronous writing to disk. By doing so, we created a faster-access cache layer on the local disk. Thus, new deployments with only code changes could bypass the slower remote storage fetch phase, reading the model weights from local cache directly.
To summarize, we managed to optimize the cold start time to some extent, and we were happy with the results:
- No cloud provision delay with standby instances.
- Faster container image pulling with on-demand and peer-to-peer streaming.
- Accelerated model loading time with distributed file systems, peer-to-peer caching, and streamed loading to GPU memory.
- Parallelized image pulling and model loading enabled by service framework.
Scaling metrics
Next, we need to identify the most indicative signal for scaling AI model deployments on GPUs.
Resource utilization metrics
Initially, we considered CPU utilization. It's straightforward and has an intuitive default threshold, such as 80%. However, the obvious drawback is that CPU metrics don't capture GPU utilization. Additionally, the Global Interpreter Lock (GIL) in Python limits parallelism, preventing high CPU utilization on multi-core instances, making CPU utilization a less feasible metric.
We also explored GPU utilization as a more direct measure of our models' workloads. However, we encountered an issue: the GPU utilization reported by tools like nvml didn't accurately represent the actual utilization of the GPU. This metric samples kernel usage over a period of time, and a GPU is considered utilized if at least one kernel is executing. This aligns with our observation that better performance can often be achieved through improved batching, even though the GPU device was already reported as having high utilization.
Note: According to the NVIDIA documentation, utilization.gpu means “Percent of time over the past sample period during which one or more kernels was executing on the GPU. The sample period may be between 1 second and 1/6 second depending on the product”.
Resource-based metrics are inherently retrospective as they only reflect usage after the resources have been consumed. They’re also capped at 100%, which presents a problem: when scaling based on these metrics, the maximum ratio for adjustment is typically the current utilization over the desired threshold (see scaling formula below). This results in a conservative scale-up behavior that doesn’t necessarily match the actual demand of production traffic.
desiredReplicas = ceil[currentReplicas * ( currentMetricValue / desiredMetricValue )]
Request-based metrics
We turned to request-based metrics for more proactive signaling that are not capped at a 100%.
QPS is a widely recognized metric for its simplicity. However, its application in generative AI, such as with LLMs, is still a question. It is not easy to configure and due to the variable cost per request, which depends on the number of tokens processed and generated, using QPS as a scaling metric can lead to inaccuracies.
Concurrency, on the other hand, has proven to be an ideal metric for reflecting the actual load on the system. It represents the number of active requests either queued or being processed. This metric:
- Precisely reflects the load on the system. Little’s Law, which states that QPS multiplied by average latency equals concurrency, provides an elegant way to understand the relationship between QPS and concurrency. In practice, the average latency per request is rather unknown in model serving. However, by measuring concurrency, we don’t need to calculate average latency.
- Accurately calculates the desired replicas using the scaling formula. Allowing the deployment to directly scale to the ideal size without intermediate steps.
- Is easy to configure based on batch size. For non-batchable models, it’s simply the number of GPUs, since each can only handle one generation task at a time. For models that support batching, the batch size determines the concurrency level.
For concurrency to work, we need the support from the service framework to automatically instrument concurrency as a metric and serve it as a scaling signal for the deployment platform. We must also establish right scaling policies to help against overzealous scale-up during a traffic spike or premature scale-down when traffic is sparse.
Request queue
A another important mechanism we integrated with concurrency is the request queue. It acts as a buffer and an orchestrator, ensuring that incoming requests are handled efficiently and without overloading any single server replica.
In a scenario without a request queue, all incoming requests are dispatched directly to the server (6 requests in the image below). If multiple requests arrive simultaneously, and there's only one active server replica, it becomes a bottleneck. The server tries to process each request in a first-come-first-serve manner, often leading to timeouts and a bad client experience.
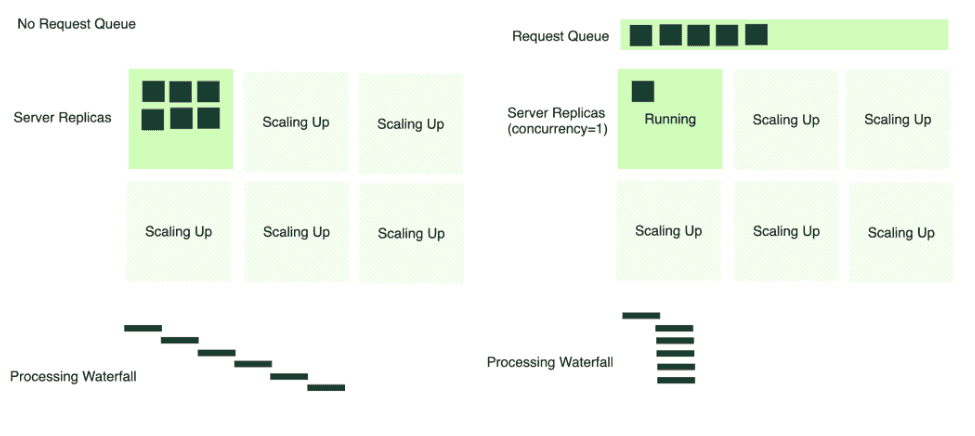
Conversely, with a request queue in place, the server consumes requests at an optimal rate, processing at a rate based on the concurrency defined for the service. When additional server replicas scale up, they too begin to pull from the queue. This mechanism prevents any single server from becoming overwhelmed and allows for a smoother, more manageable distribution of requests across the available infrastructure.
Conclusions
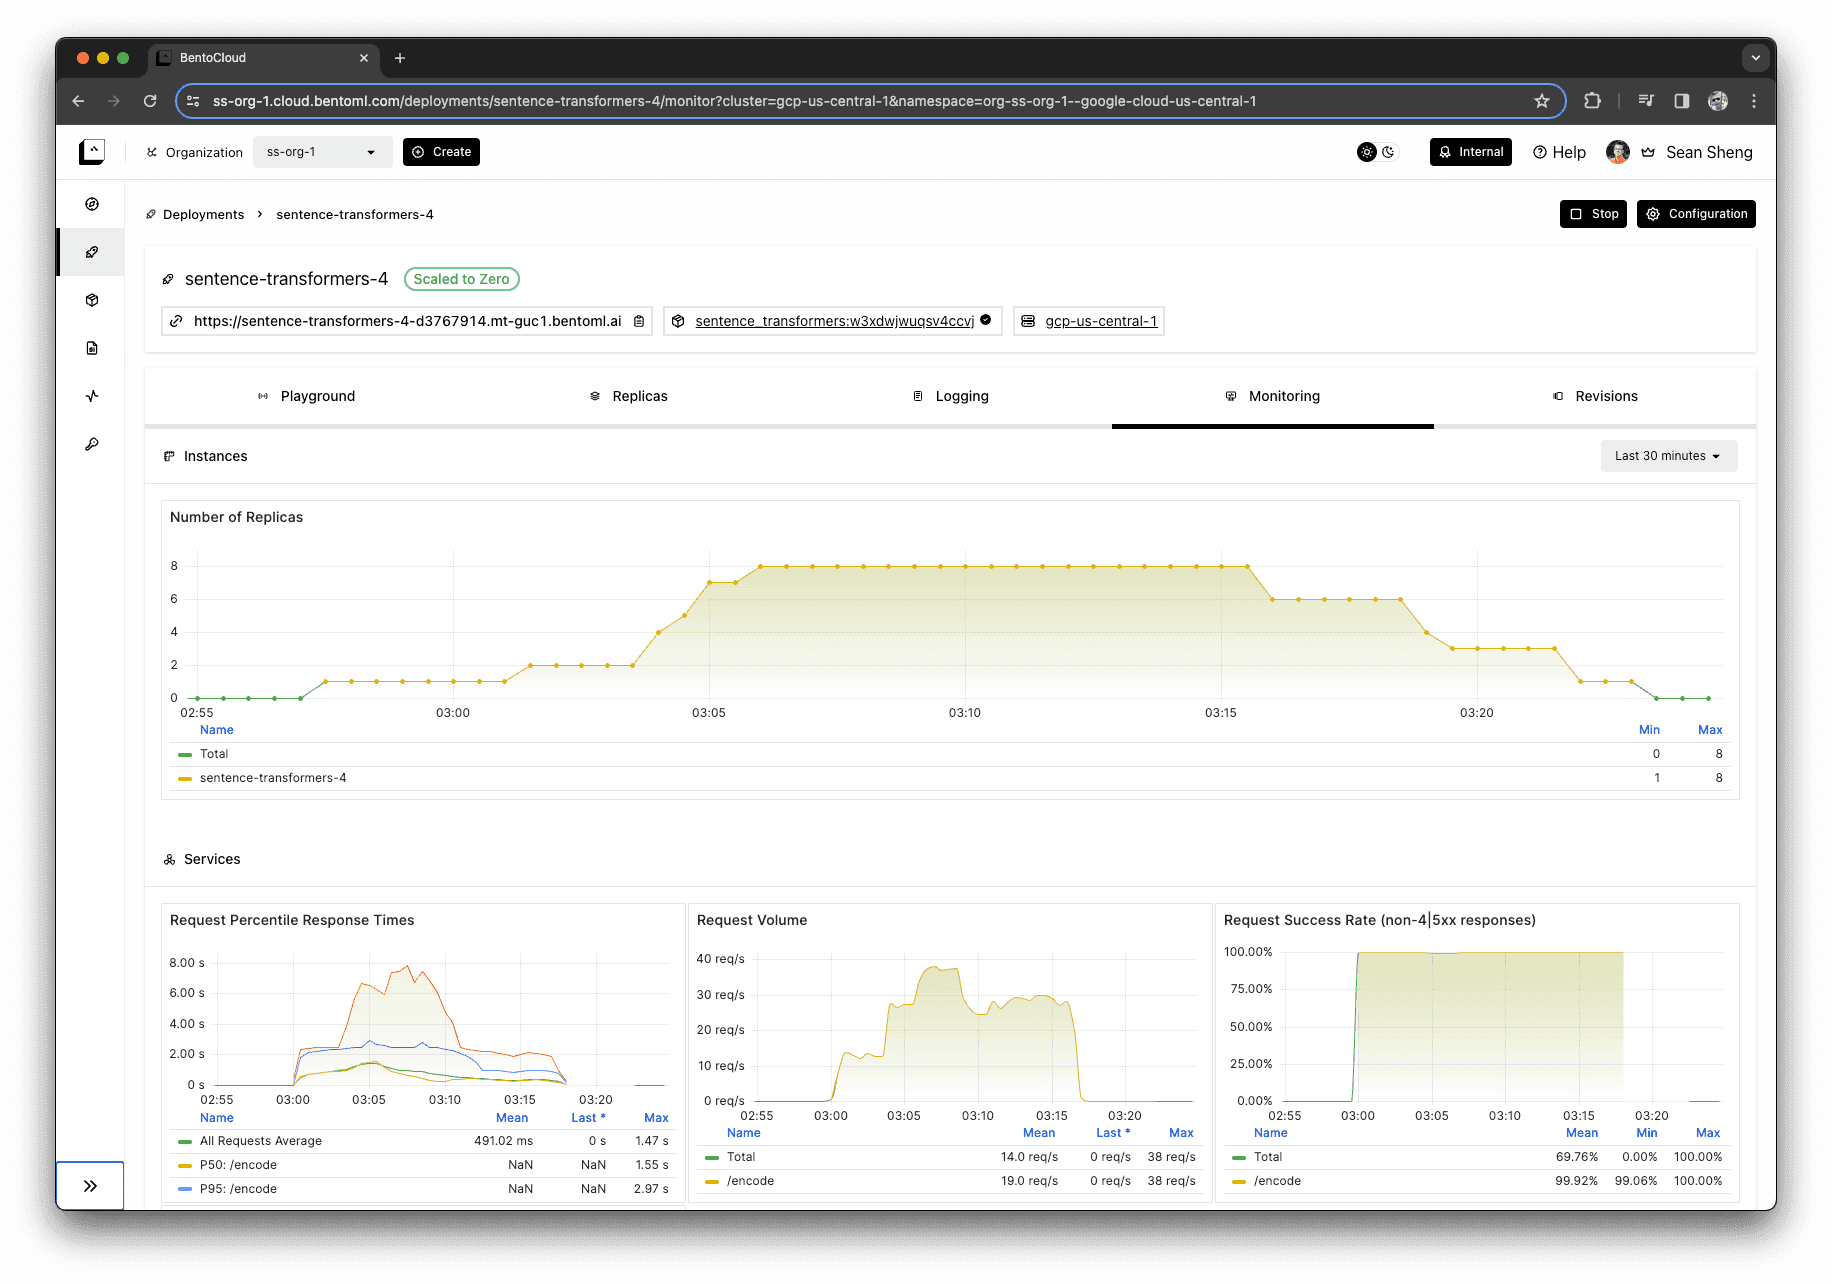
Our journey in exploring AI model scaling solutions has been an adventure, which has led us to ultimately create the scaling experience on BentoCloud — a platform that encapsulates all our learnings.
To avoid the impression of a promotion, we’ll illustrate our point with a picture that’s worth a thousand words. The monitoring dashboard below demonstrates the correlation between incoming requests and the scaling up of server instances.
Equally important to scaling up is the ability to scale down. As the requests waned to zero, the deployment reduced the number of active instances accordingly. This ability ensures that no unnecessary costs are incurred for unused resources, aligning expenditure with actual usage.
We hope the takeaway is that scaling for model deployments should be considered an important aspect of production applications. Unlike scaling CPU workloads, scaling model deployments on GPUs presents unique challenges, including cold start times, configuring scaling metrics, and orchestrating requests. When evaluating deployment platforms, their solutions to these challenges should be thoroughly assessed.
More on BentoCloud
- If you are interested in our serverless platform BentoCloud, sign up now and get $30 in free credits! Experience a serverless platform tailored to simplify the building and management of your AI applications, ensuring both ease of use and scalability.
- Join our Slack community to get help and the latest information on BentoML and BentoCloud!